Debugging Sitecore asp.net core rendering host project with pipeline processor logic
One of the challenges I faced with asp.net core rendering host Sitecore Docker project is debugging. I hear many out there hollering at me, "what is the big deal select the connection type as Docker Windows Container and you are done". No, I have a twist for you. Have you ever tried to debug logic written in pipeline processor from a asp.net core rendering host project?
Unfortunately, I did not find any blogs touching this aspect of debugging apart from Sitecore documentation stating select cm container and w3wp process to debug platform project but I felt there is more to it. So, this blog covers the general debugging process since the asp.net rendering host is exe-based and debugging gets tricky if multiple target frameworks are involved (and, the chance is high in case of asp.net rendering host solution), also add Docker to the mix.
I have used the Sitecore MVP project since it has multiple target frameworks and here are some screen shots to help understand better.
So, some context, as soon as you run the up.ps1 since the MSBuild process is in action,

Should be able to see the latest DLLs and the startup project exe in the docker\deploy\mvp-rendering folder:

Now, if you want to debug logic (controller logic or startup.cs) in the asp.net core exe, it is as follows:
1. Select Docker Windows Container
2. Set the code type (nothing but target framework in generic format) for your asp.net core project
3. Then, select the asp.net core exe project process - very similar to how you debug a windows exe

The most crucial part for debugging a project is the target framework and it must match the code type above, which is core in this case as per project properties:

Now, if you add debug points in both the pipeline project and the asp.net core project, the debug points in the pipeline projects won't be hit! Some screen shots to understand this better:
Stops here:

Does not identify this:

Now, why doesn't logic in pipeline processor not get hit and what should you do to debug such logic?
Let's cover that next:
Stop debugging.
Attach the debugger one more time but this time, select these properties:
No, surprises with the connection type since it will stay Docker Windows Container
While Connection target is the cd container here
And, most importantly, the code type you attach should match the target framework in the project properties you are trying to debug. So, not core but 4.x this time!


My pipeline processor project properties for reference:

Note that you are attaching to w3wp.exe in this case and the exe project is not found in the (attach) process list since core project's target framework (in other words, code type) is not 4.x - Just reiterating!
Now, once you attach the w3wp process and refresh the cd instance home page, the pipeline processor debug point will get hit and here it is for reference:

Also, note that the default controller debug point is unreachable since it is based on the core framework:

So, if you have a VS solution with multiple projects targeting different frameworks, ensure you select the correct code type!
Note that although my machine is 64-bit, I don't think the processor selection matters and "Any cpu" option works just fine but adding that for reference since you might use VS to build the solution rather than running up.ps1 every time:
This is how I visualise the whole thing in a very simplified way:
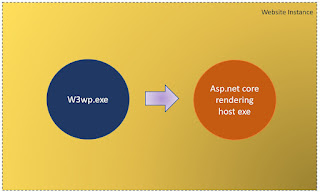
There is a logical grouping based on platform and application components running in two different processes. The rendering host is dependent on Sitecore instance' w3wp process. So, pipeline processors execute first and provide the needed context for the asp.net rendering host exe. So, one more time: you have a two-step debugging process here since target framework is different!
This is a paradigm shift compared to how we are used to debugging Sitecore MVC applications so far since pipeline processors debugging and application logic debugging happened in the same process context but not in this case since they run in two different processes now!
Visual Studio version for reference:

ASP.NET workload for reference:


Comments
Post a Comment