Sitecore Pipeline Profiler
I came across the pipelines.aspx under the admin folder of my instance. I found some interesting use of the page and so here is a blog as a result:
Access Pipelines.aspx:
Get the following message if this is the first time you are accessing:
Pipeline Profiler
A snapshot from the pipeline profiler.
Pipeline profiling is disabled. No data is currently available.
To enable pipeline profiling, add the following key "<add key="env:define" value="Profiling" />" to Web.config <appSettings> section.
To measure CPU usage during pipeline profiling, set the value of the "Pipelines.Profiling.MeasureCpuTime" setting to "true". Measuring CPU usage adds a performance overhead to the pipeline but provides additional information about the behavior of the processors.

Based on the message, I setup my root web.config:
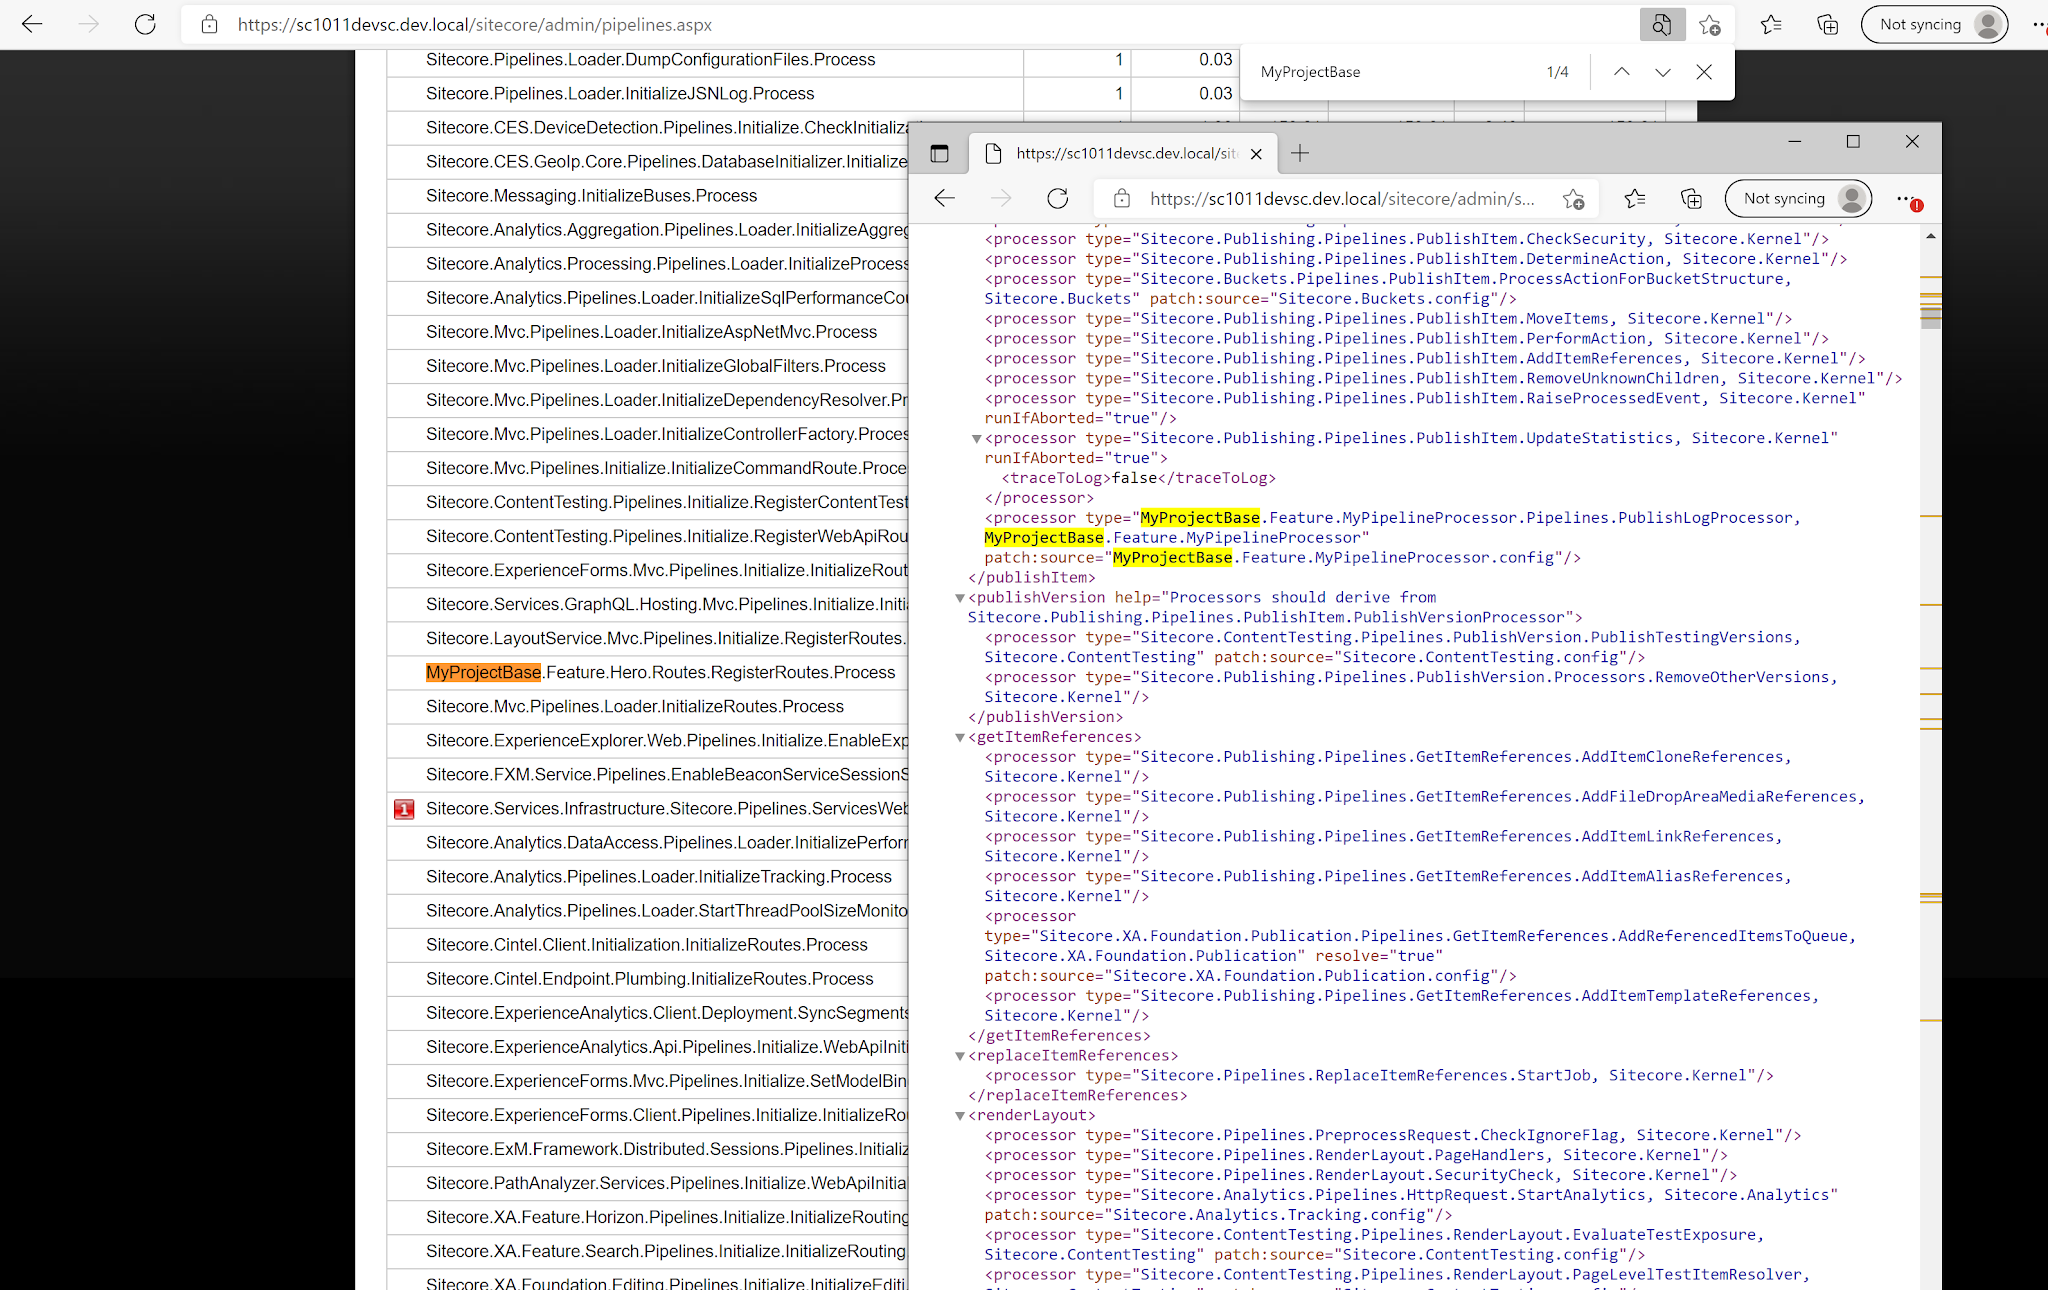
With just the above setting in place, I accessed the pipelines.aspx page to find the following list -

There is a legend in the bottom of the page to describe what each of those columns mean:
| #Executions | The number of executions of the pipeline or processor |
|---|---|
| Wall Time | Total wall time spent in all executions of the pipeline or processor |
| % Wall Time | For a processor, percentage of total pipeline execution time that is spent executing this processor |
| Max Wall Time | Wall Time of the longest execution of a pipeline or processor |
| % CPU | For a processor, percentage of total pipeline CPU usage that is spent executing this processor |
| Time / Execution | Average time taken by a single execution of the pipeline or processor (wall time) |
At this point, when I cross-checked the showconfig.aspx for Pipelines.Profiling.MeasureCpuTime, I find this setting:
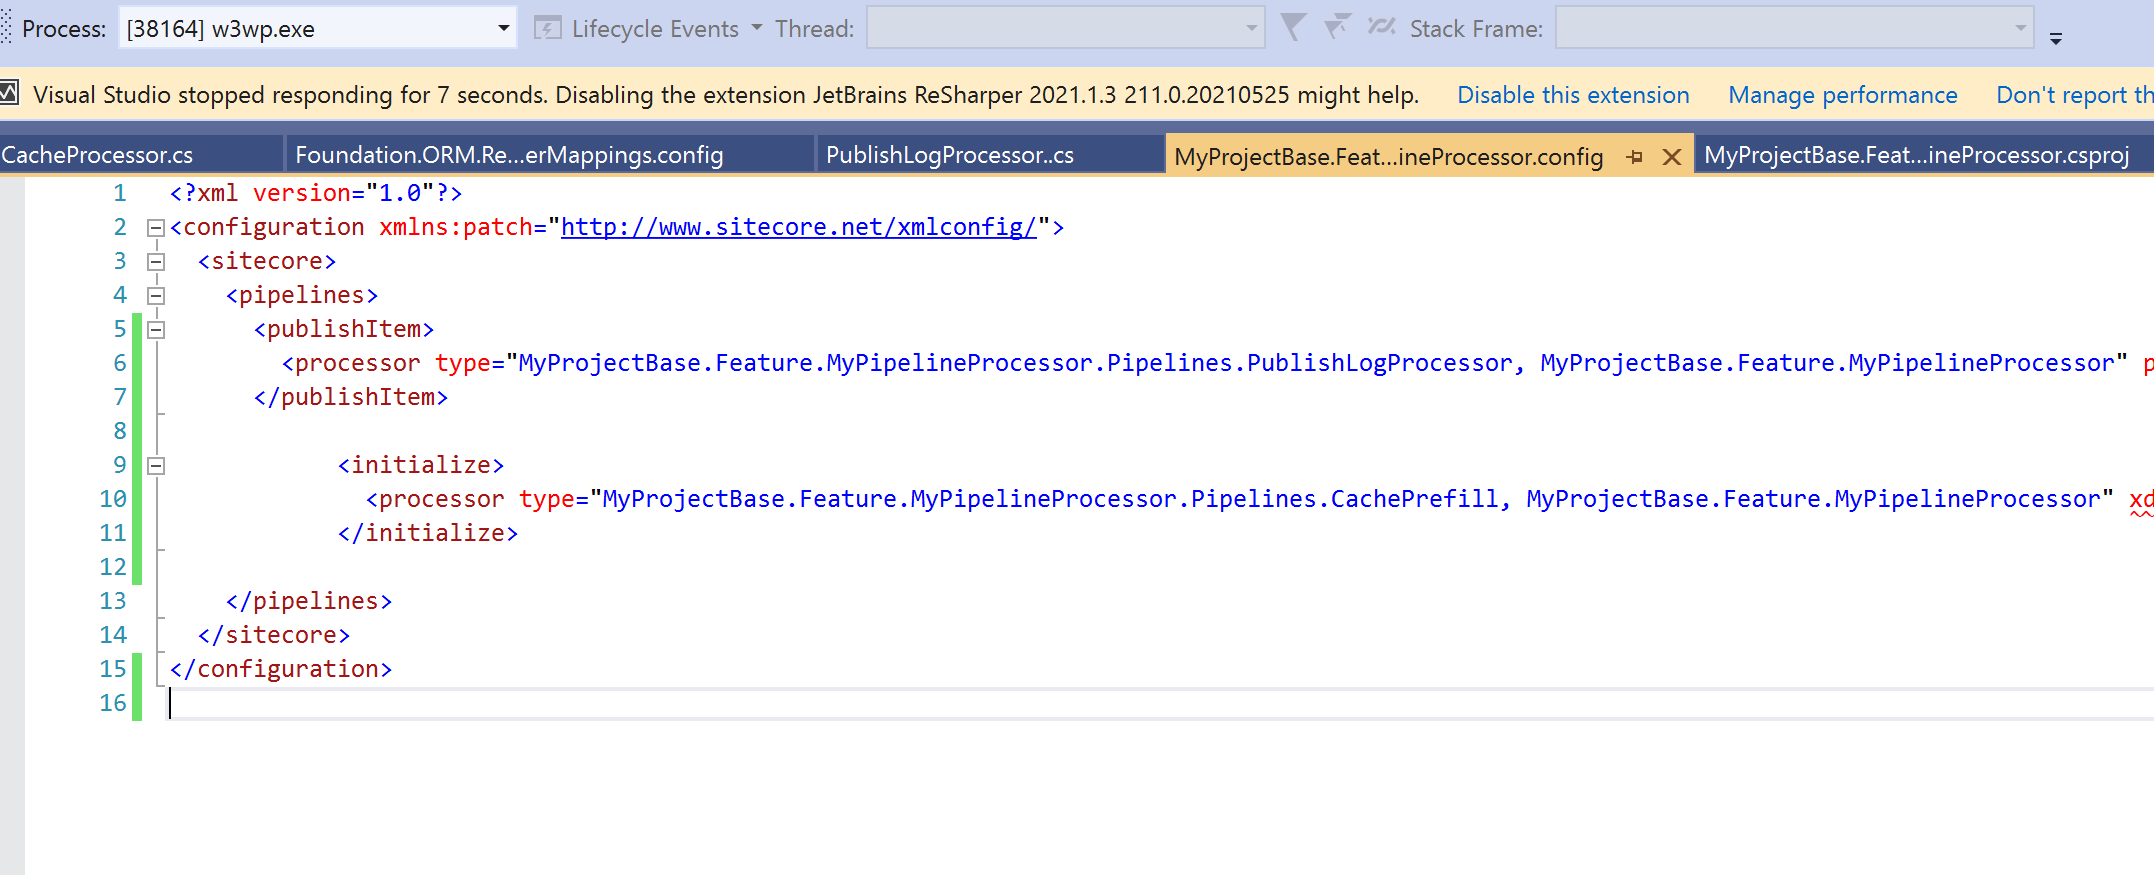
Since the setting comes from Sitecore.PipelineProfiling.config under <web root>\App_Config\Environment, I just added a patch under a xxxx folder -


Comments
Post a Comment